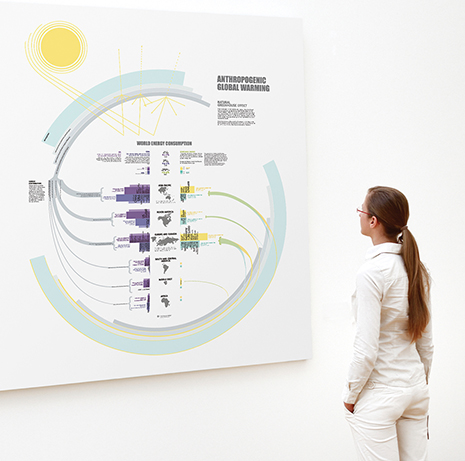
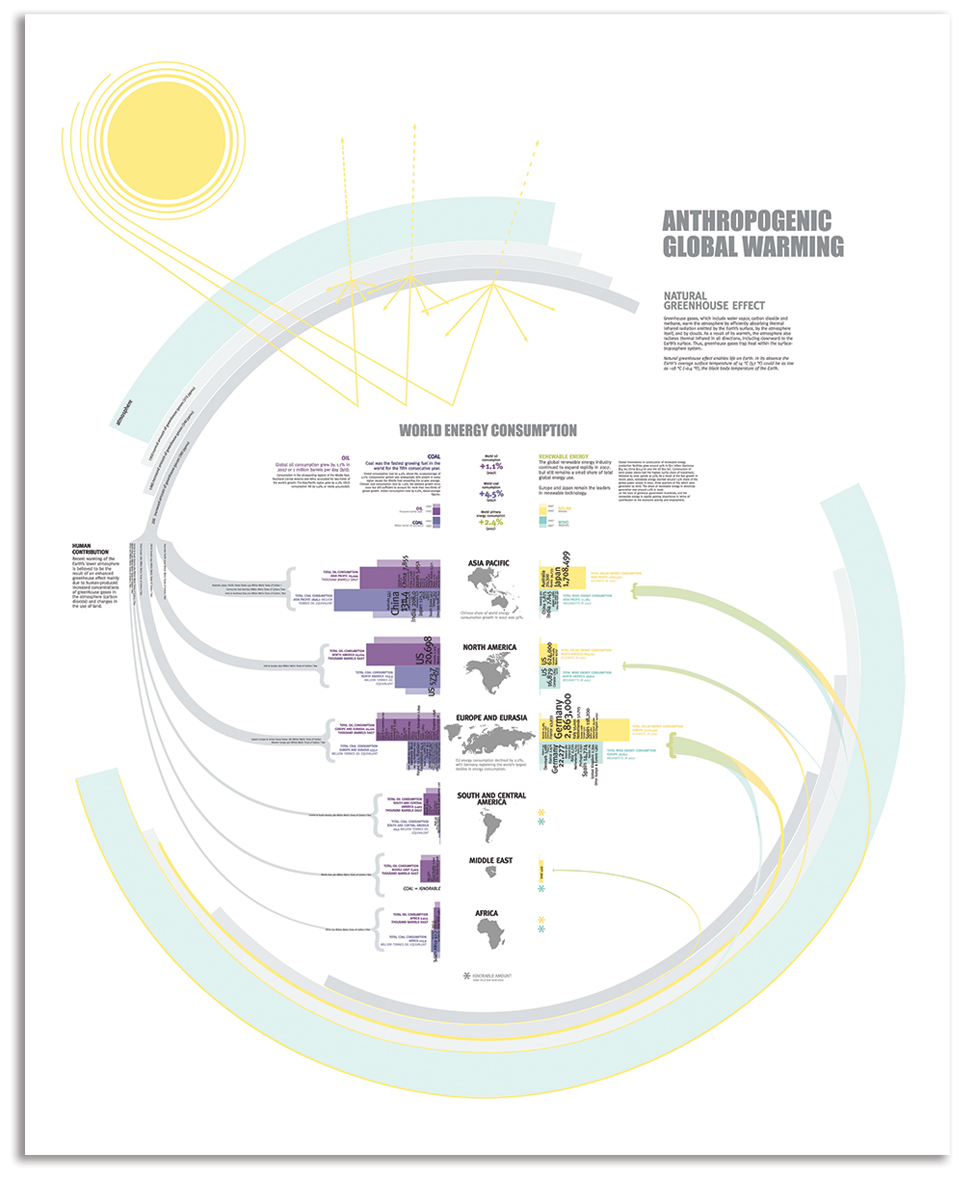
Infographic showing world coal and oil consumption, use of renewable energy, and increase in concentration of greenhouse gasses. By displaying data per country, this graphic shows who is most responsible for the current situation.
WHILE
@
PARSONS SCHOOL OF DESIGN
2009